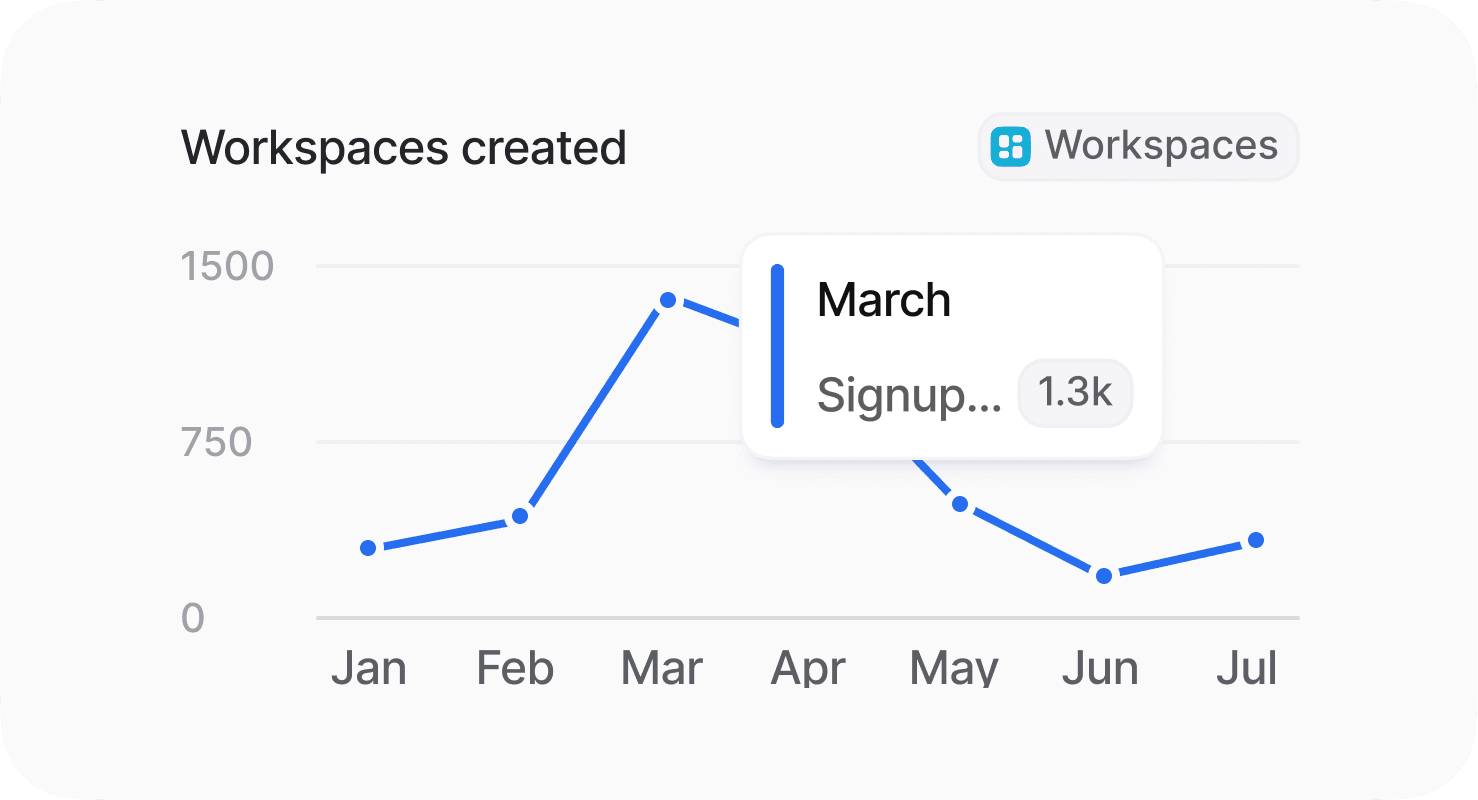
Daily workspace creations.
New signups as they land, counted day by day.
Forecasts you can trust, pipeline health that updates itself, and insights only possible in Attio.
The answer ready the moment you need it.
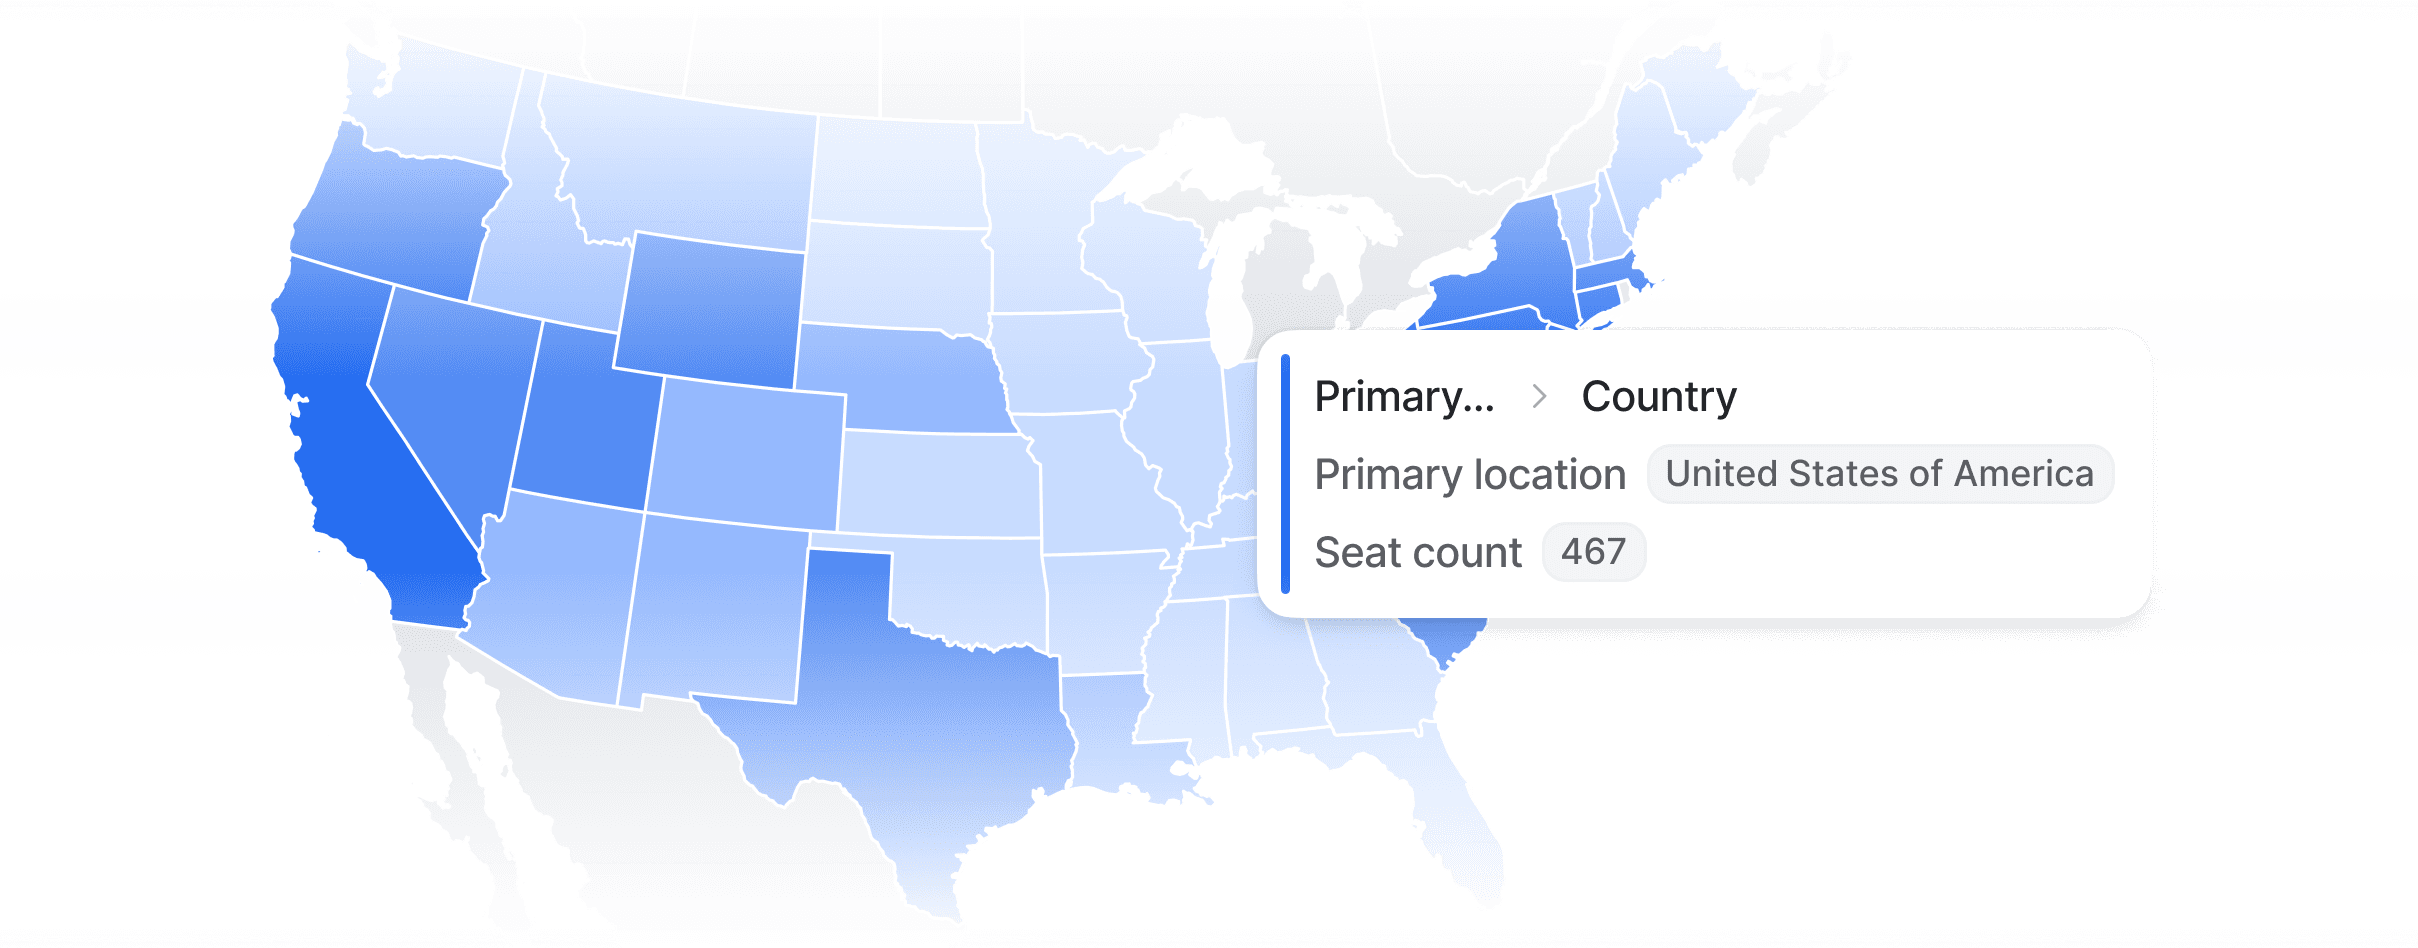
Group by anything you track, in the format of your choice.
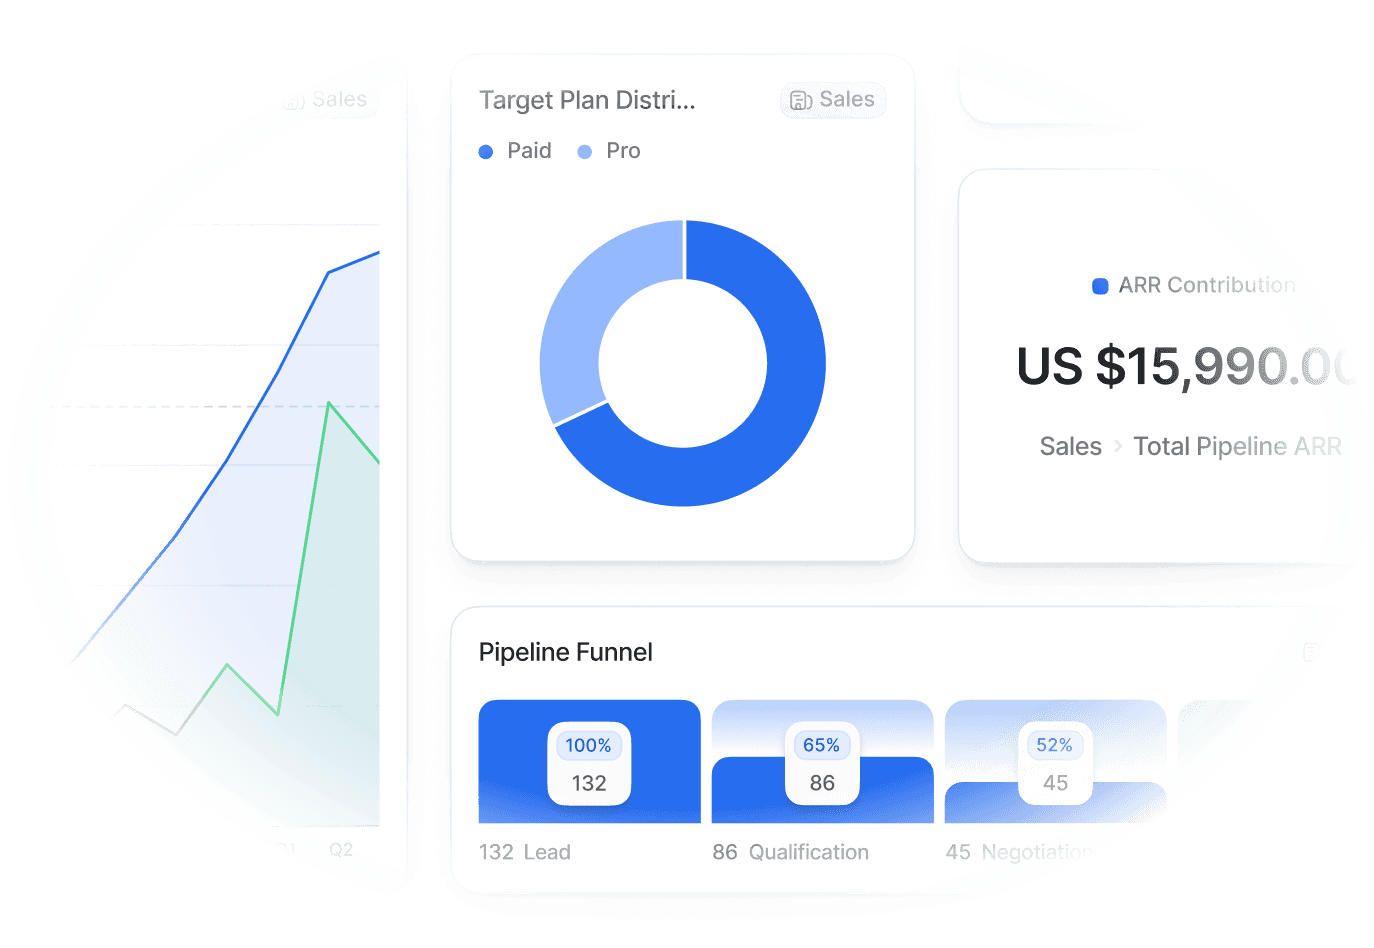
Where deals stall, how long they sit, and what changed since last quarter.
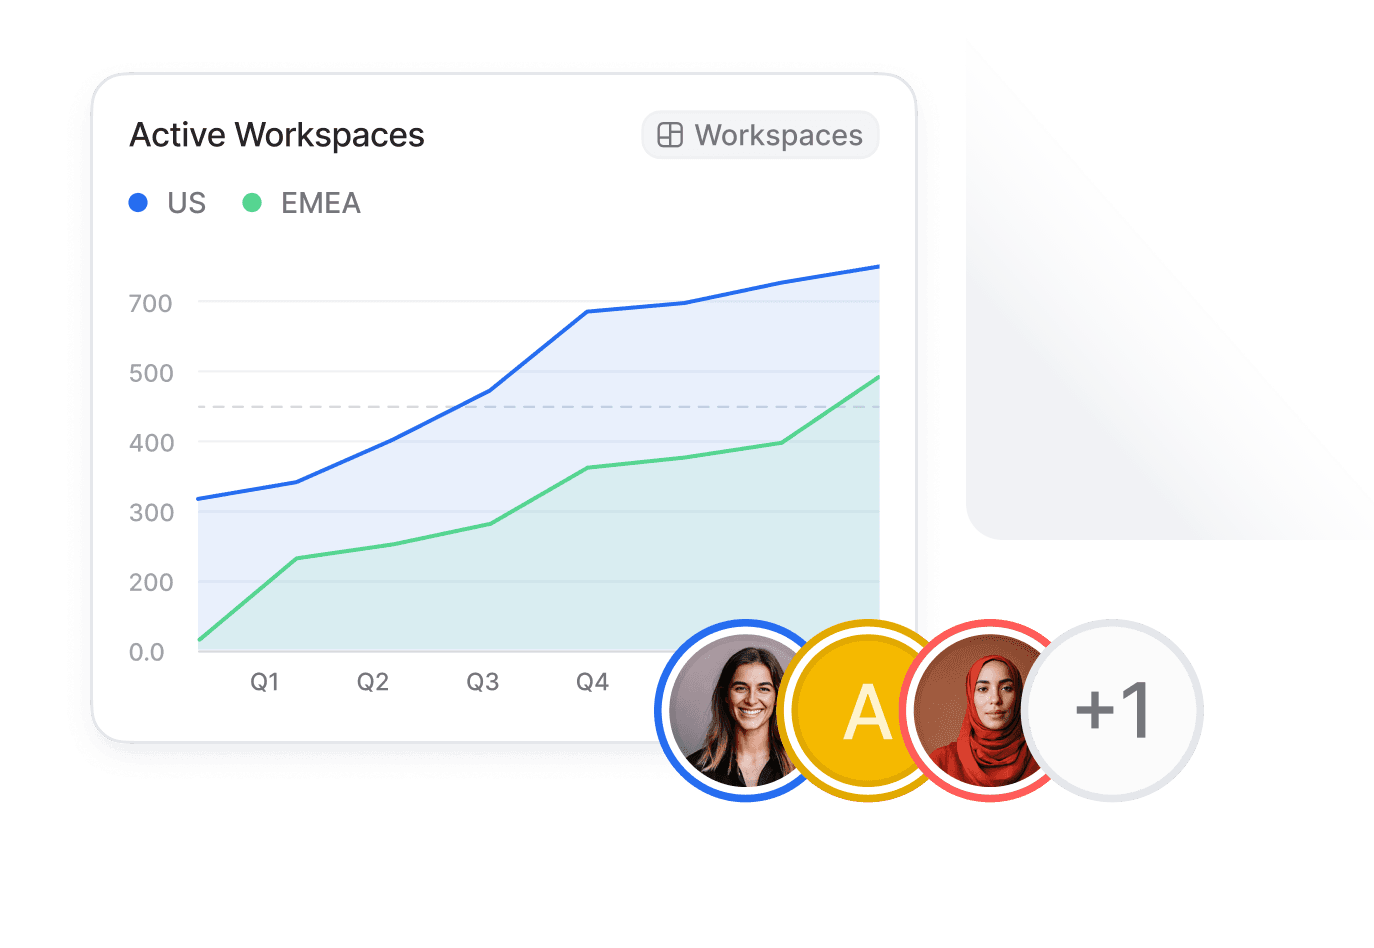
Share a dashboard with your workspace or another team.
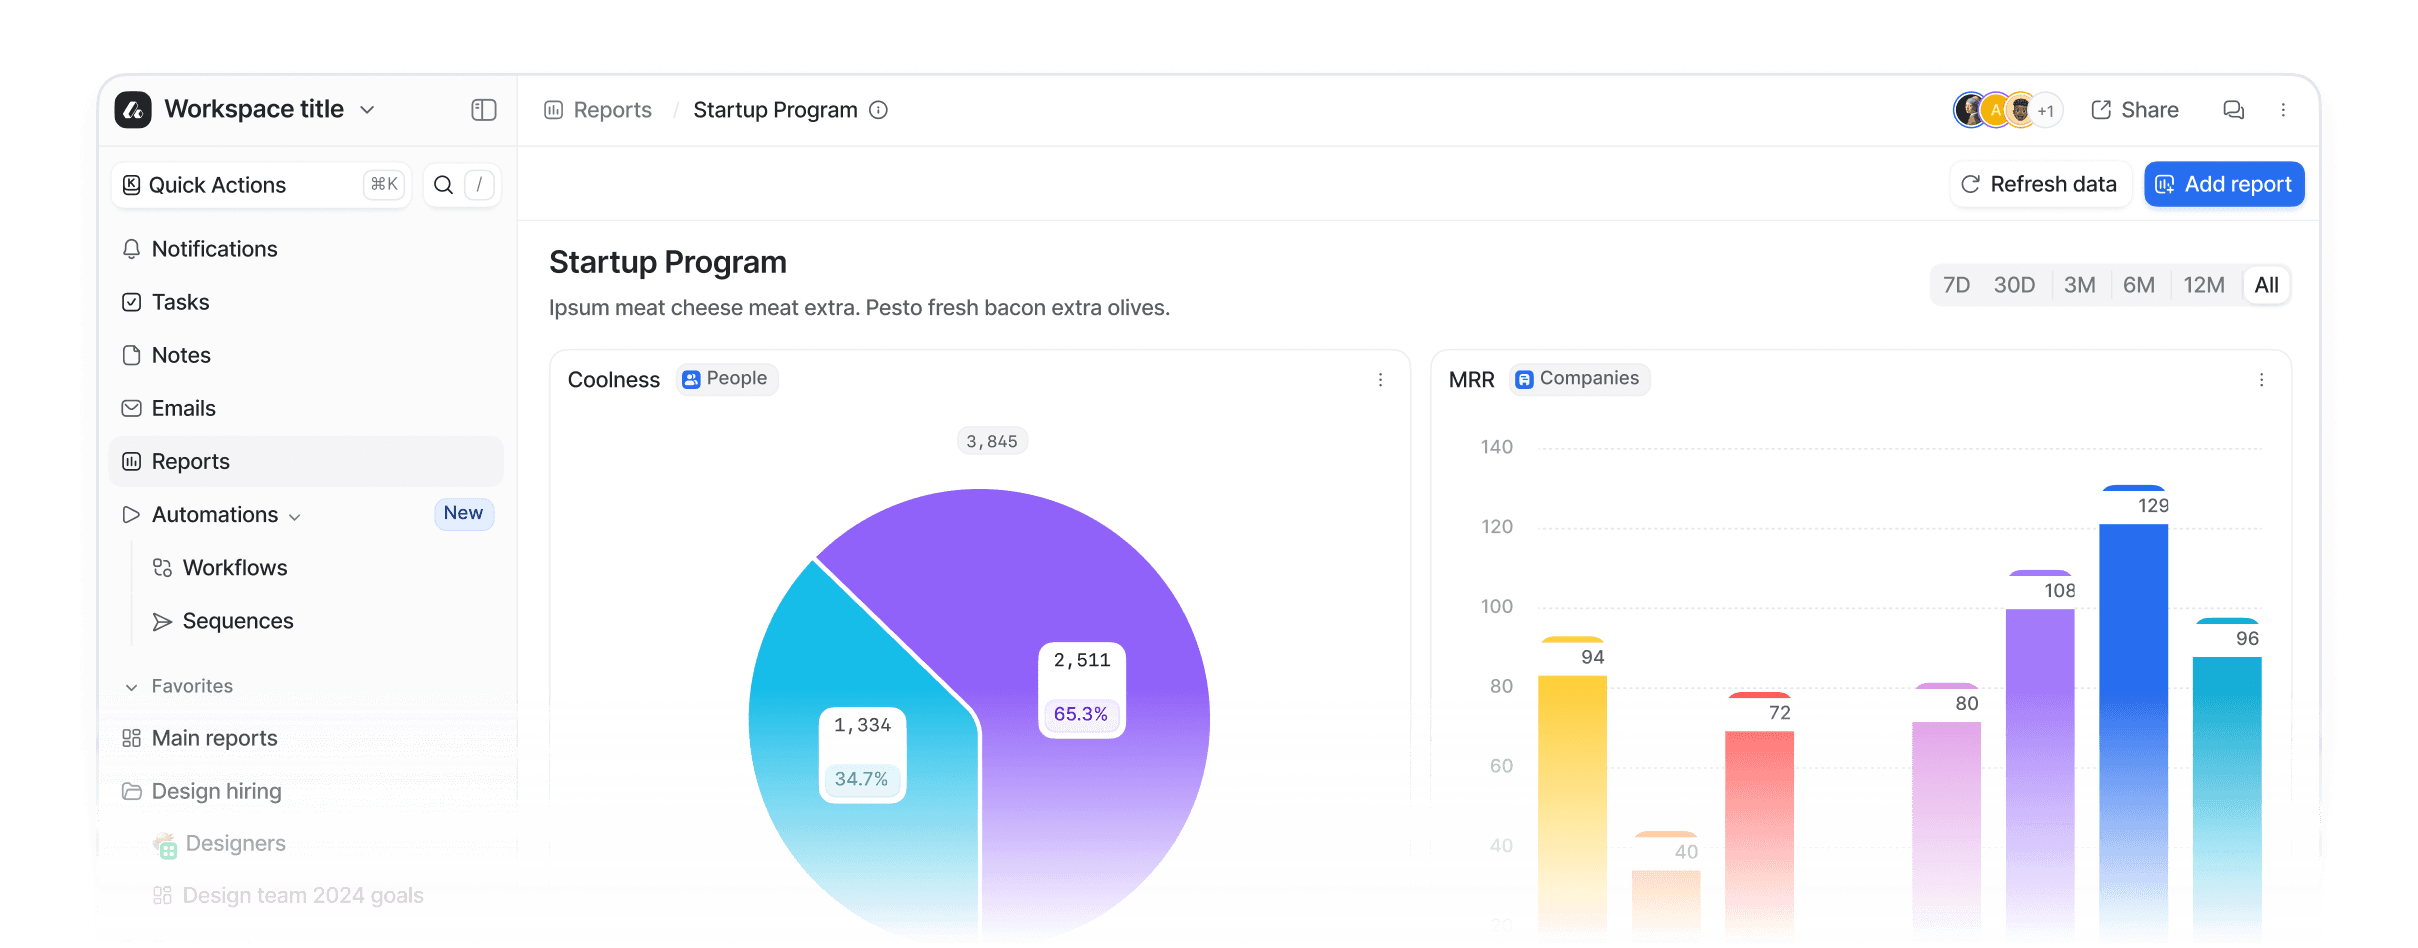
A live board your whole team can see, arranged by how you actually work.
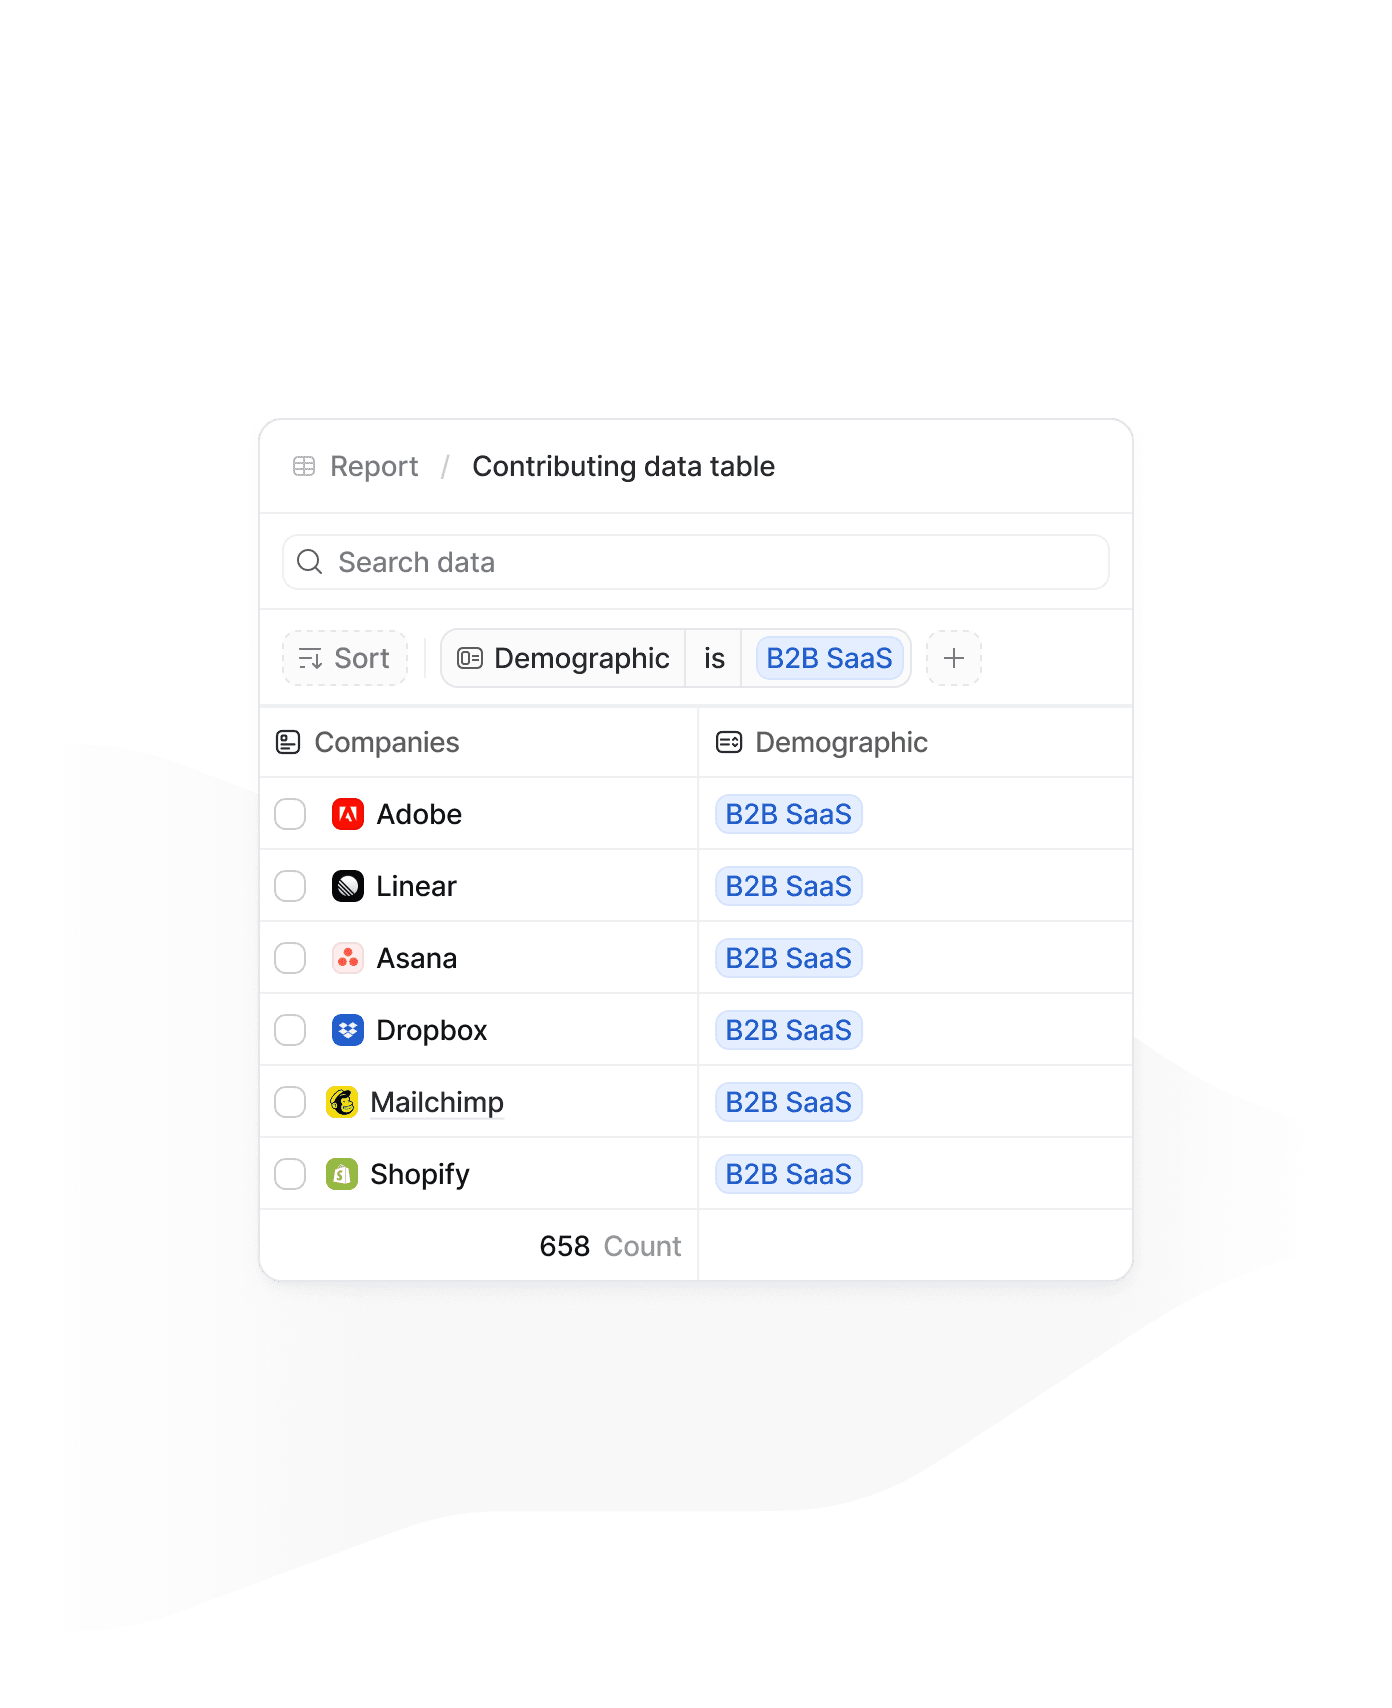
See how it moved, and the deals that moved it.
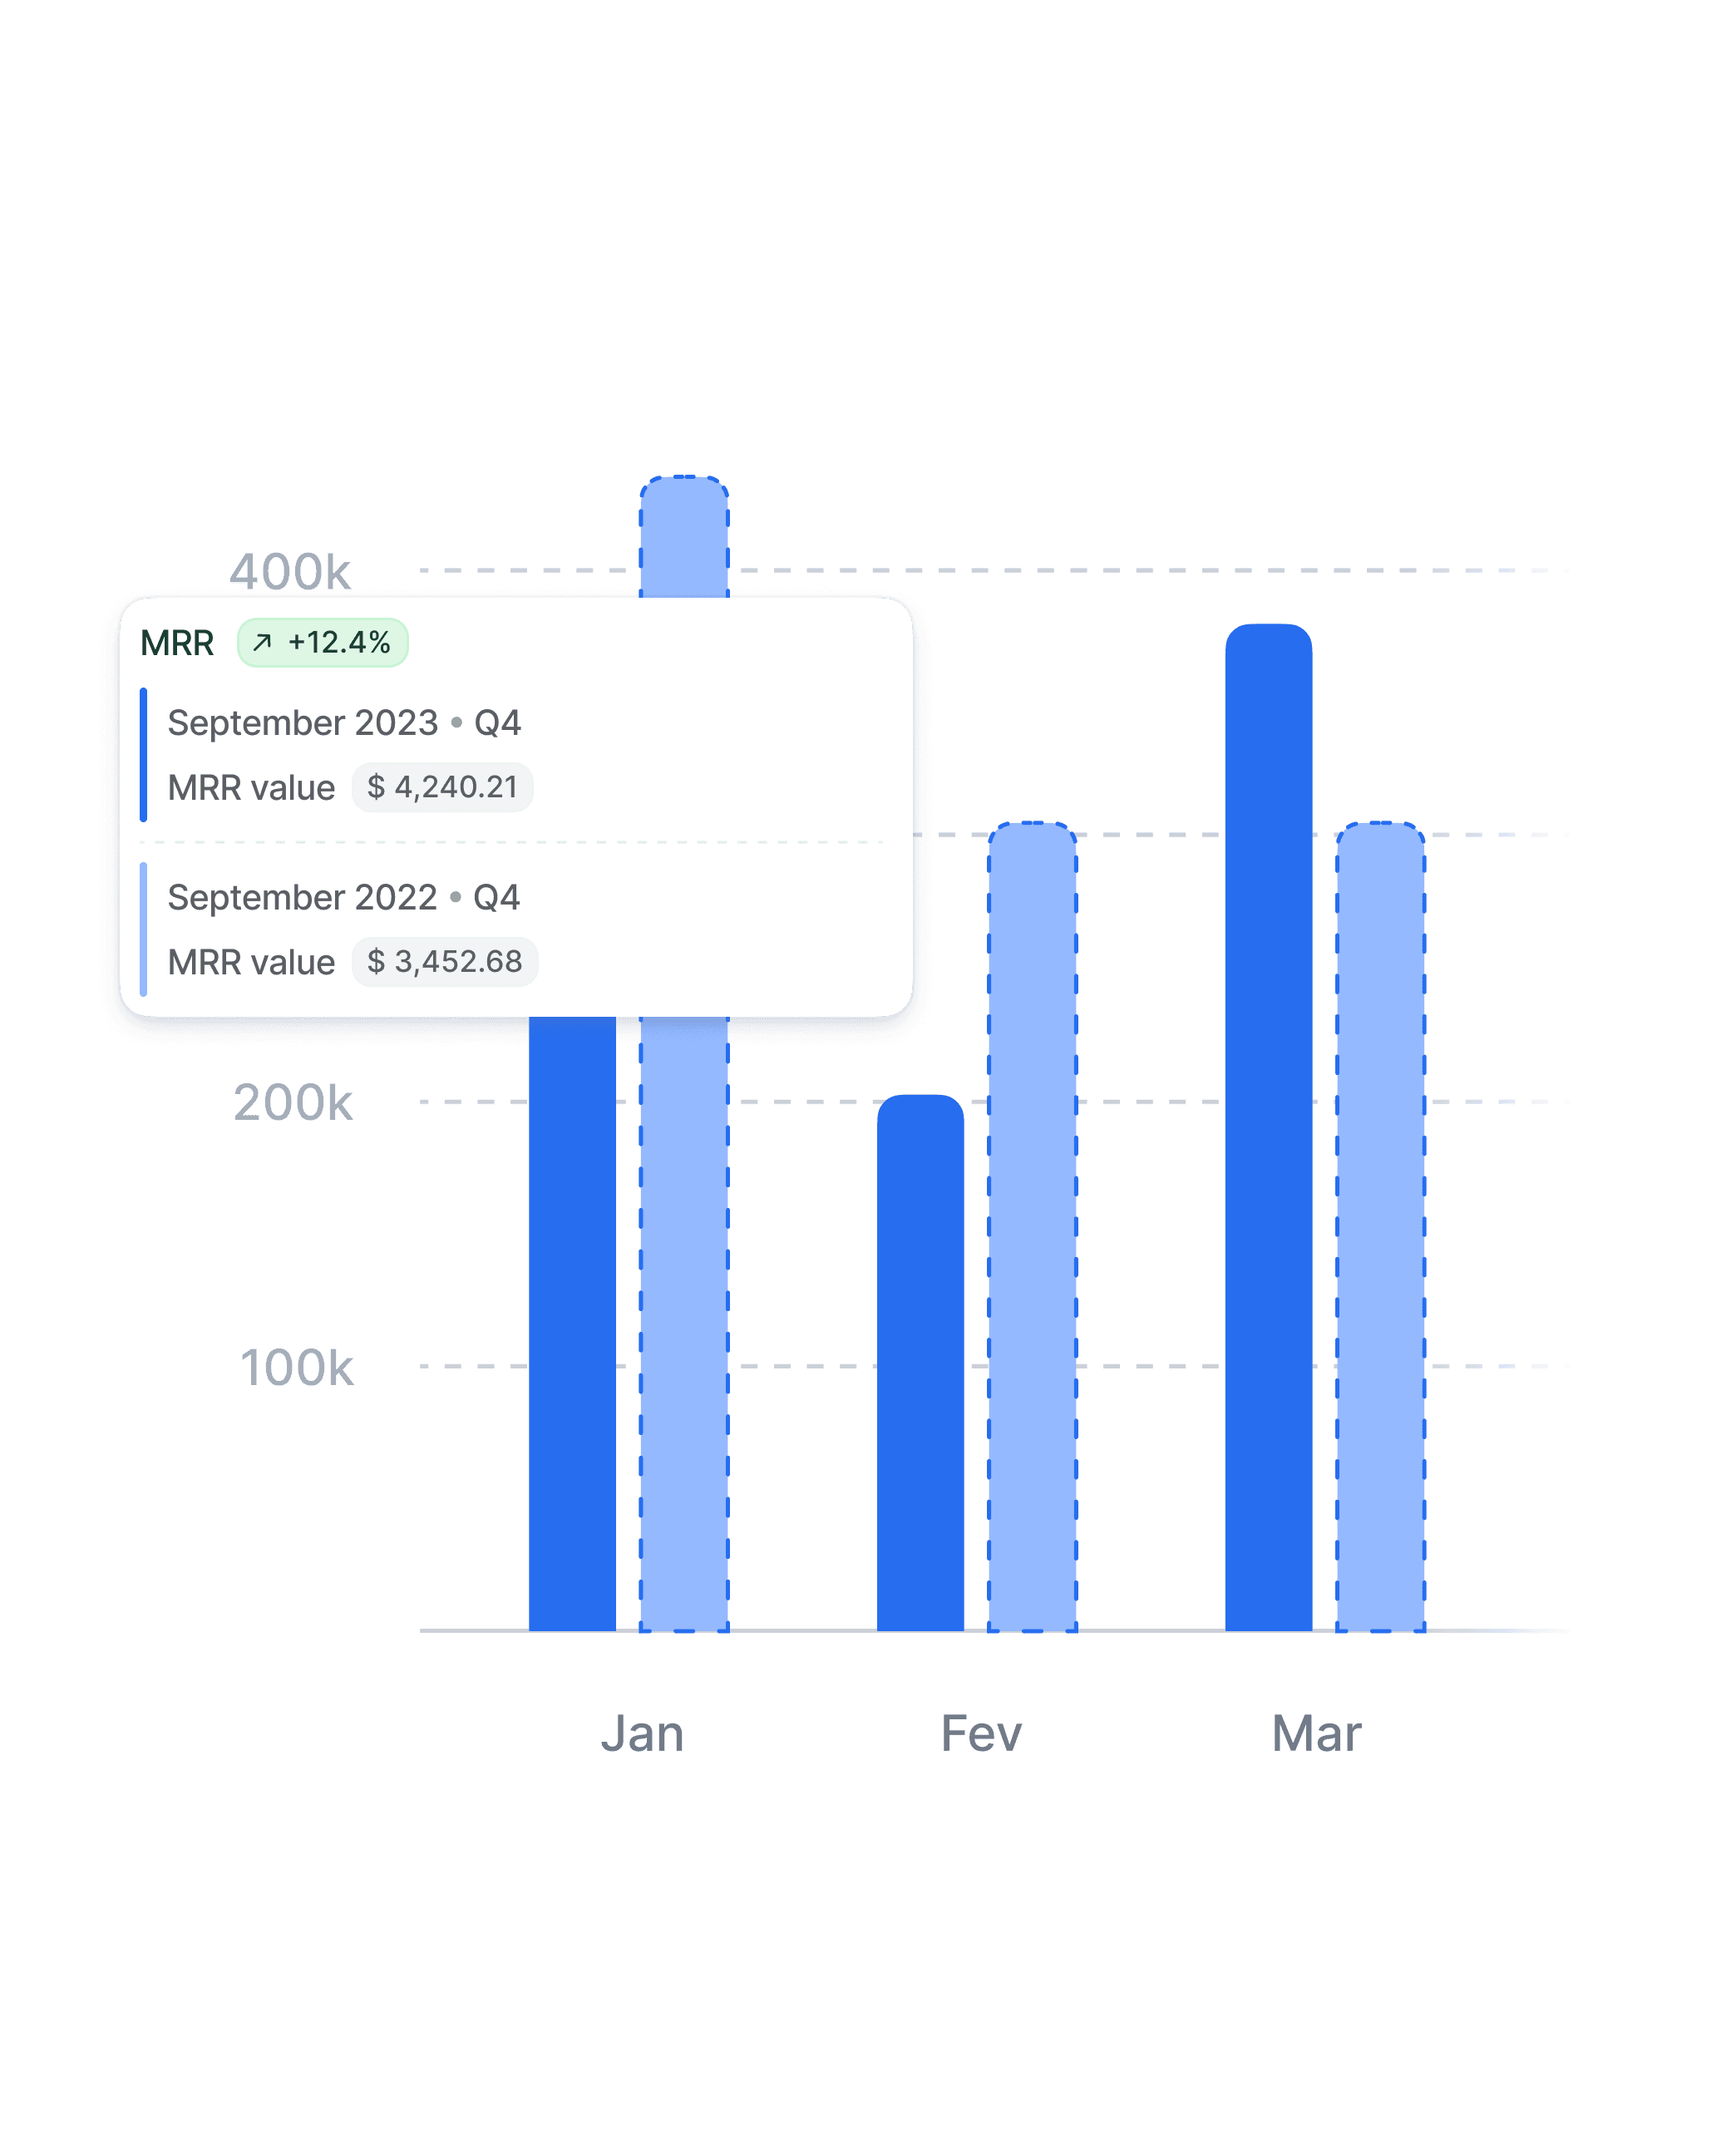
Context becomes leverage, turning raw data into computed values like weighted pipeline and lead scores.
New signups as they land, counted day by day.
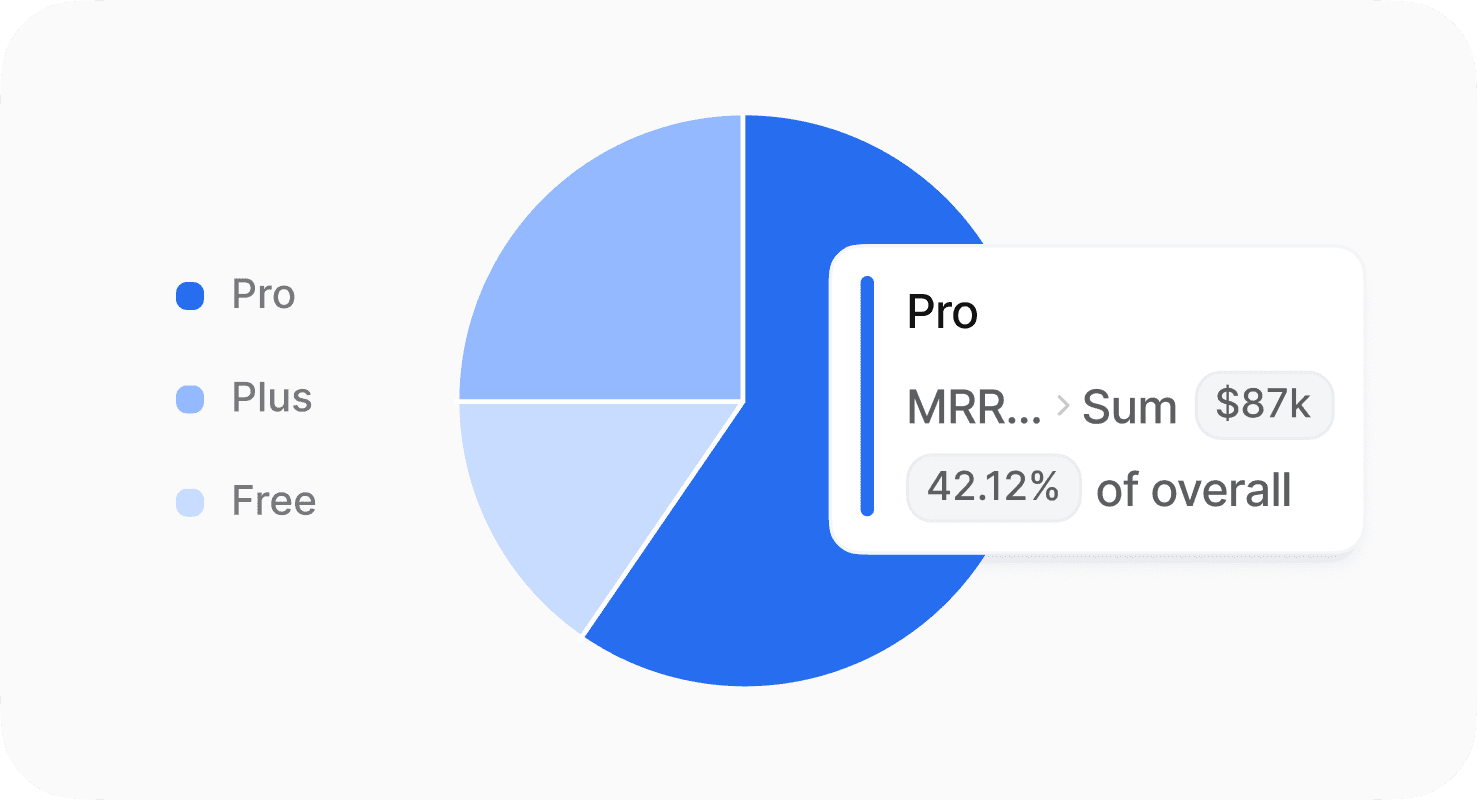
Where revenue actually comes from, split by plan.
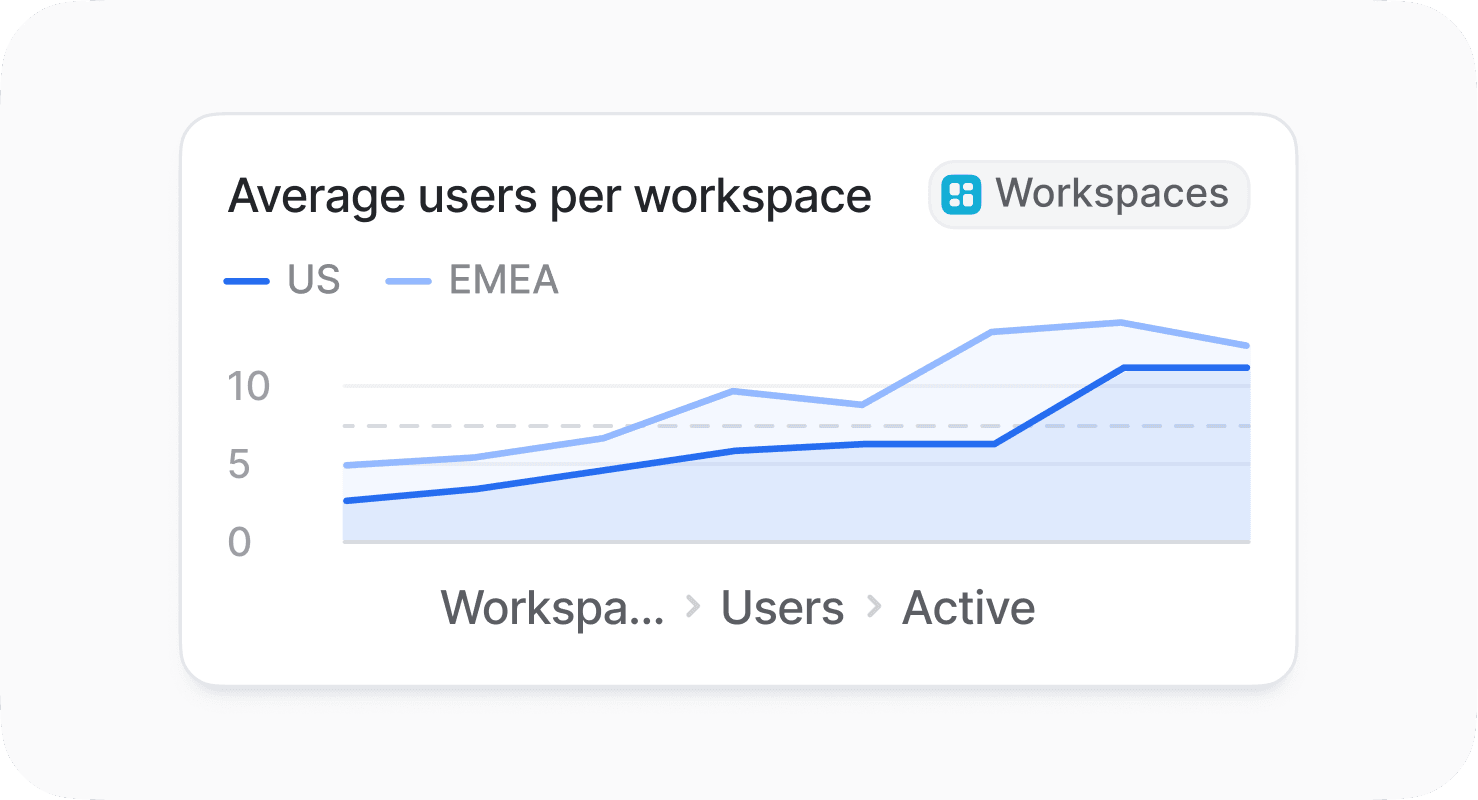
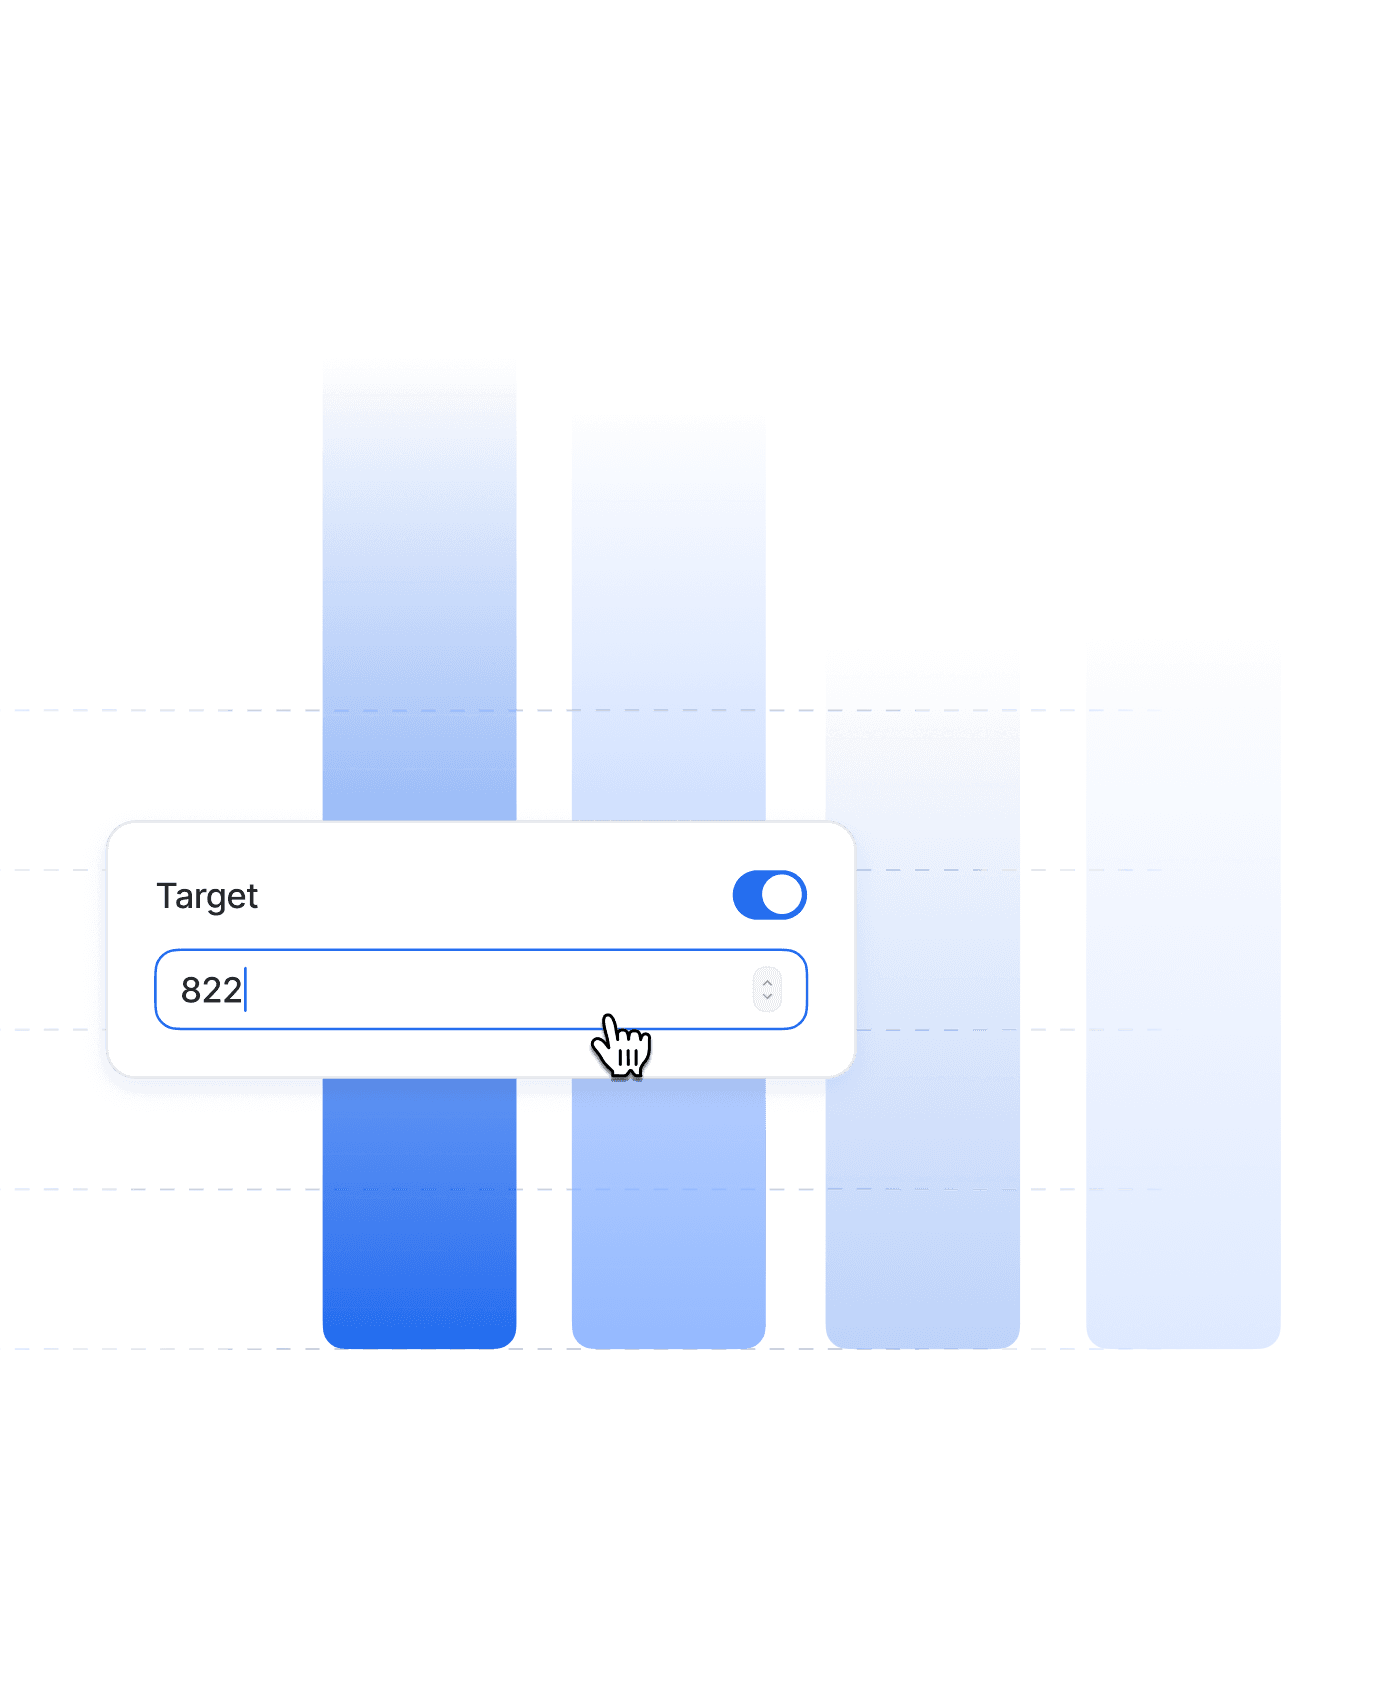
Active users per workspace, tracked against target.
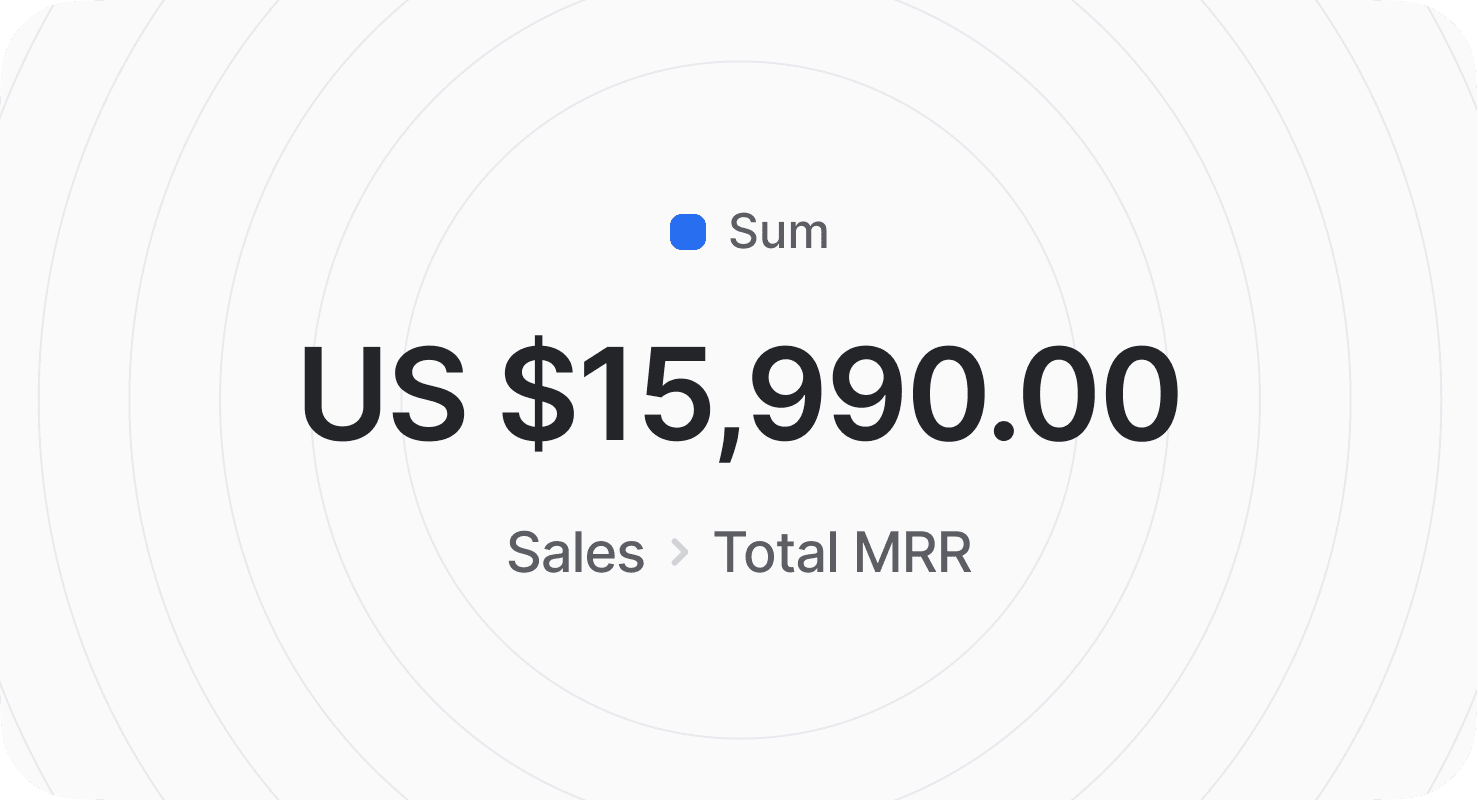
One number for where MRR stands right now.
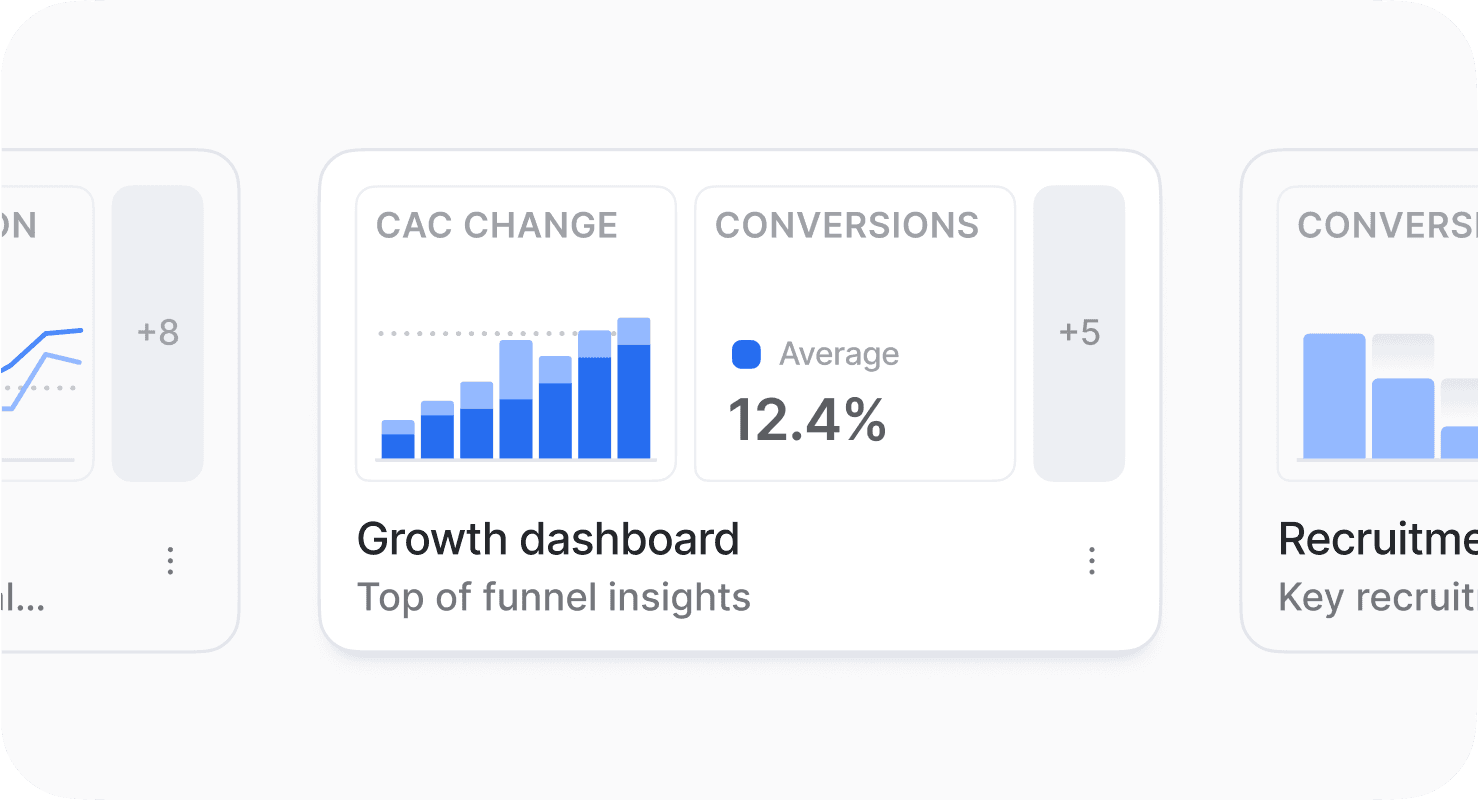
What it costs to win a customer, and which way that's trending.
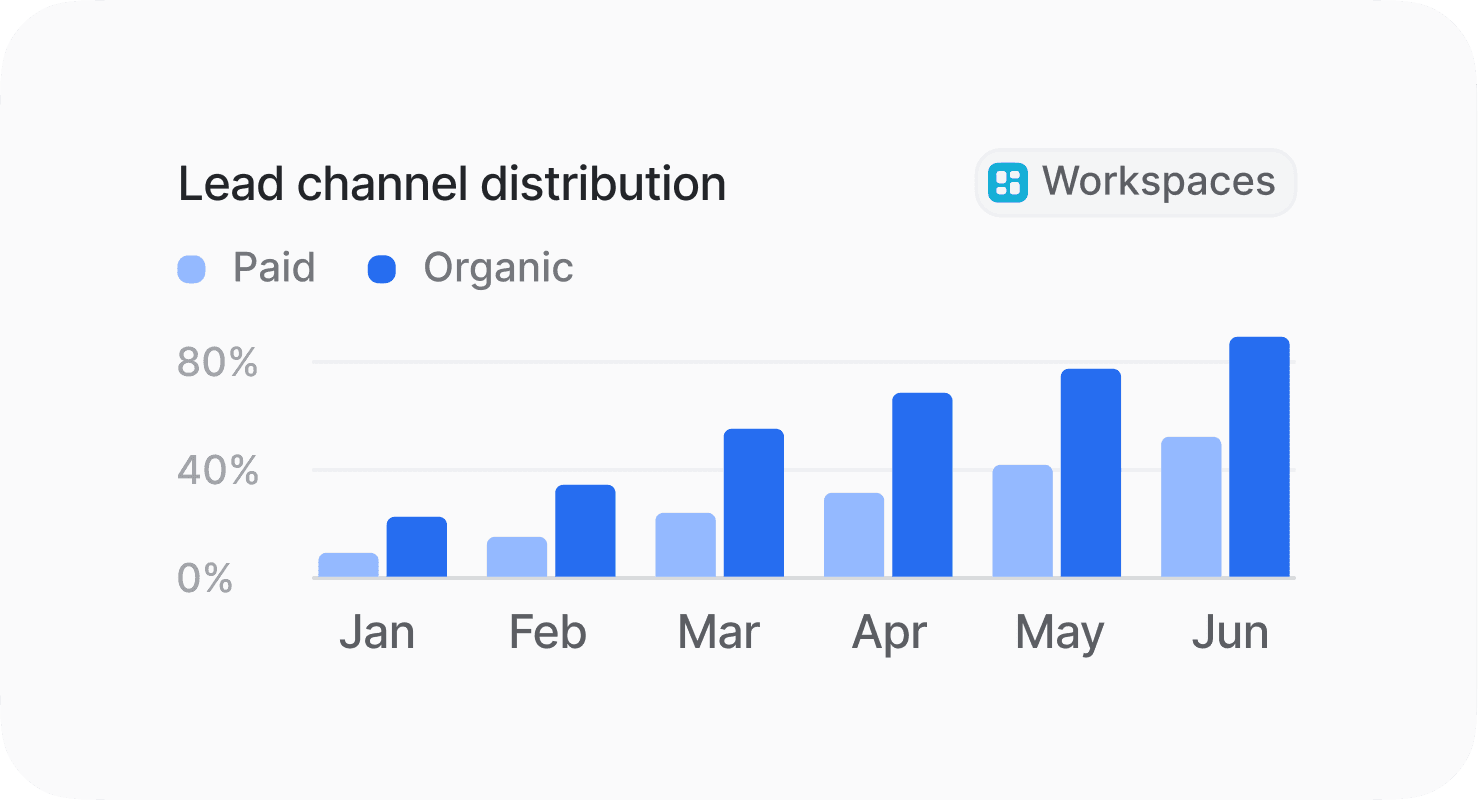
How the mix of paid and organic is shifting.